These software come as stand-alone Windows executables and do not require Java RE, MATLAB or other run-time environment to run. They are free to use and provided “as-is”, without any express or implied warranty. Please contact Dr. Chang (wakamchang~@um.edu.mo) for comments and suggestions.
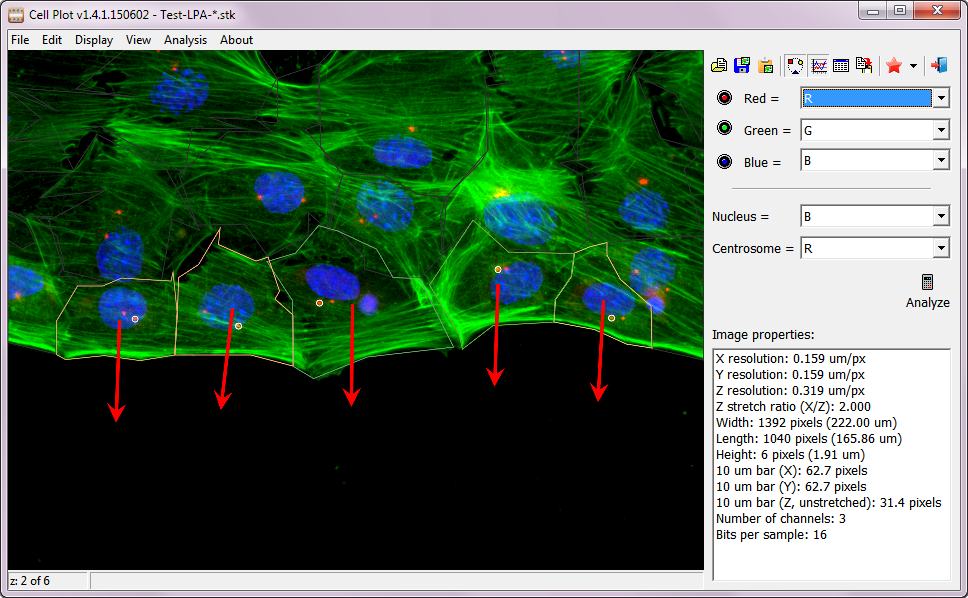
Cell Plot
Cell Plot is used to measure centrosomal and nuclear positions (in relative to the cell centroid) ans is described in Chang W et. al, Methods Mol Biol 2016. It automatically detects the positions of nuclei and centrosomes, draws cell boundaries, looks for wound edge and determines the direction of cell migration. Cell Plot allows manual correction in case if the detection is not perfect.
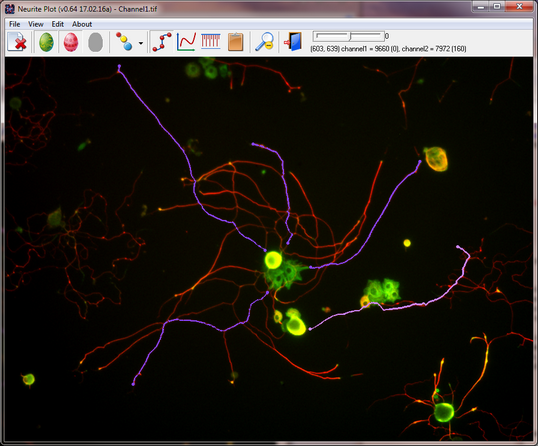
Neurite Plot beta
Neurite Plot is a proof of principle program for tracing individual neurite. After clicking a starting point (either from cell body, end of a neurite, or any where on a neurite), the user can move the mouse to any location, and a trace between the starting point and the mouse location will be generated. Optionally, user can click to add a mid-point to control the trace. We have used it to successfully measure microtubules with different post-translational modifications along and at the end of neurites.
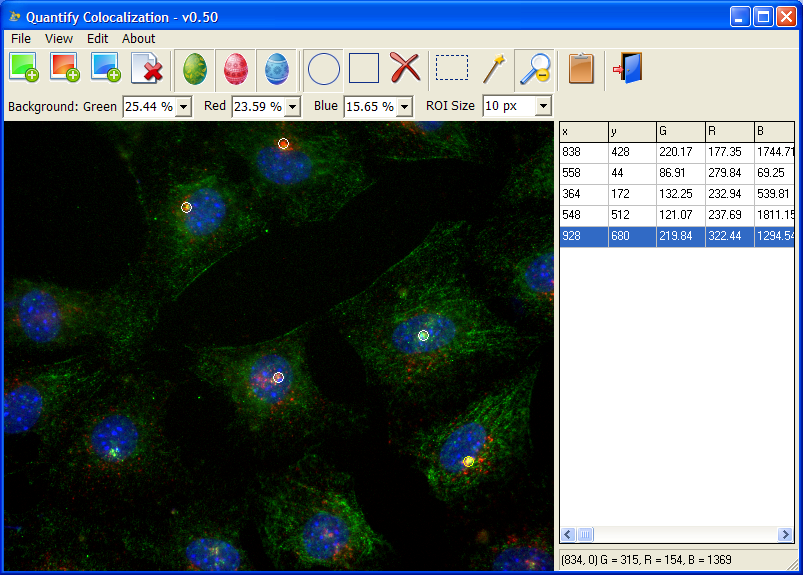
Quantify Colocalization
Quantify Colocalization is to quantify fluorescent signals from multiple channels to test whether there is a correlation between them. It is really simple but it does the job quite well. The idea is that you can open multiple (up to three) images, click to create simple, same-size ROIs, and the program will quantify the average signals in those ROIs.
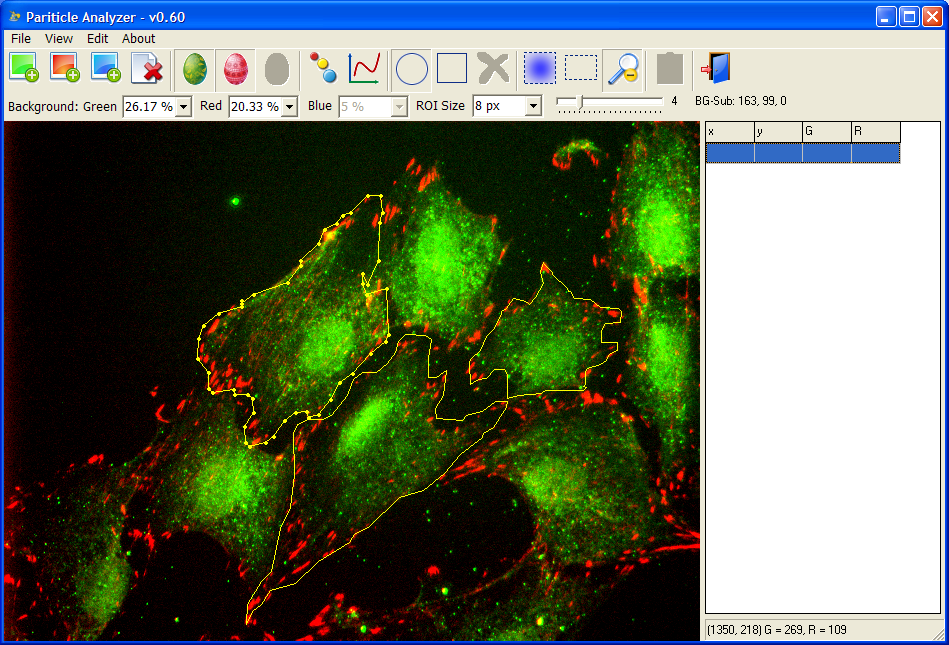
Particle Analyzer
By using local background subtraction and other mathematical morphology operations, Particle Analyzer is able to detect hundreds of particles of various sizes and shapes almost instantly. After opening the images, the user draws the boundaries of the cells, and the program will detect particles in the cell and calculate their positions, sizes, signals from each channel, distances to the membrane and cell centroid.
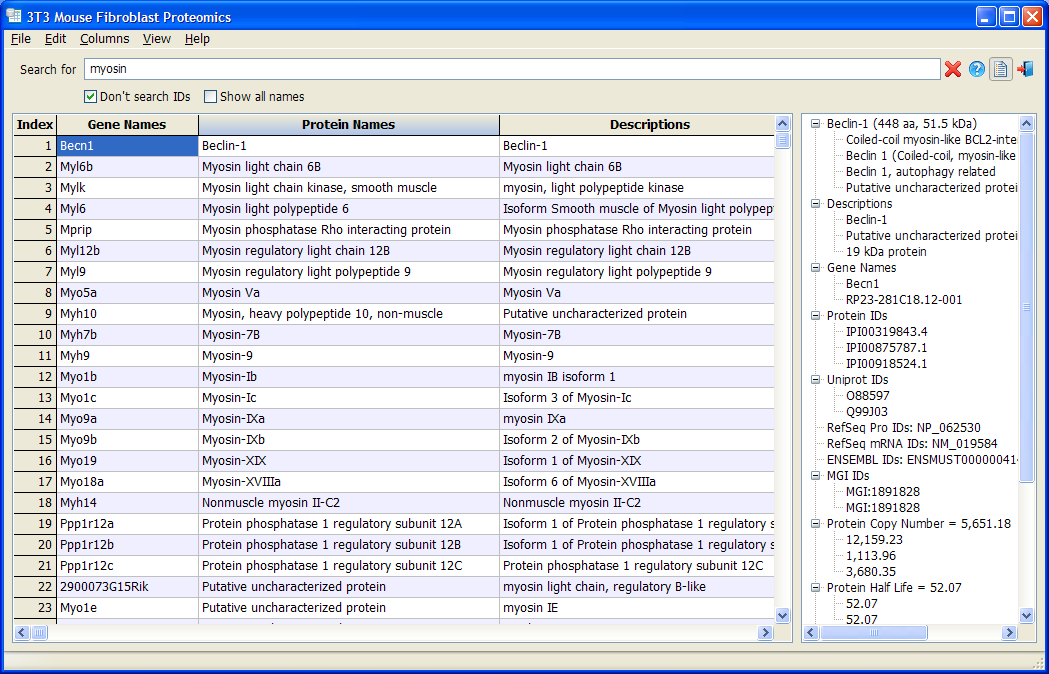
3T3 Mouse Fibroblast Proteomics
3T3 Mouse Fibroblast Proteomics is a database based on
Schwanhäusser et. al., Nature 2011 and its
Corrigendum. All data are displayed in a customizable table. Users are allowed to hide or show each column, change the font and colors, and sort the data with any column. A data panel shows all the detail information of a gene in an organization tree view. The most useful feature is that user can filter genes by keyword or combination of keywords.