Feature
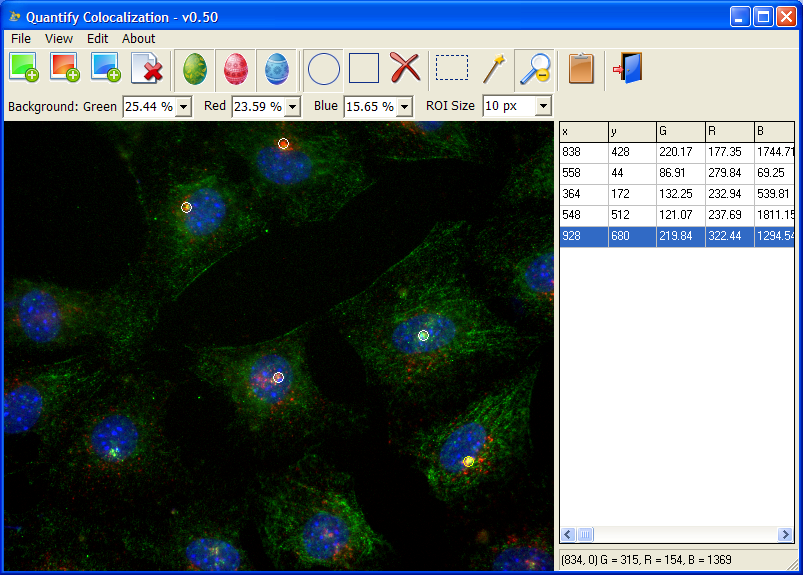
- Single click to create ROIs.
- ROIs can be moved with mouse, or deleted by right clicking.
- ROI size can be changed at any time, it applies to all ROIs, including the existing ones.
- ROIs can be square or circular. Changes applies to all ROIs, including the existing ones.
- All channels can be hidden, providing a way to do things blindly.
- Has built-in global background subtraction and it is intuitive. Simple click the set background icon (5th from right) and use the mouse to select a rectangle. The average intensity will be used for background subtraction.
- Final results can be copied to the clipboard and paste to
Excel for statistical analysis.
How to use
To try using
- Double click to run
CountSignal.exe . - Drag and drop
Green (MLC).tif . - Drag and drop
Red (Tf).tif . - Start clicking on particles.
- Click the copy button to copy the results to the clipboard.
- Open
Excel and paste the result in to it.
Note, you can drag and drop Blue (DAPI).tif to the program at any time, even after creating ROIs. The program will recalculate accordingly.