Features
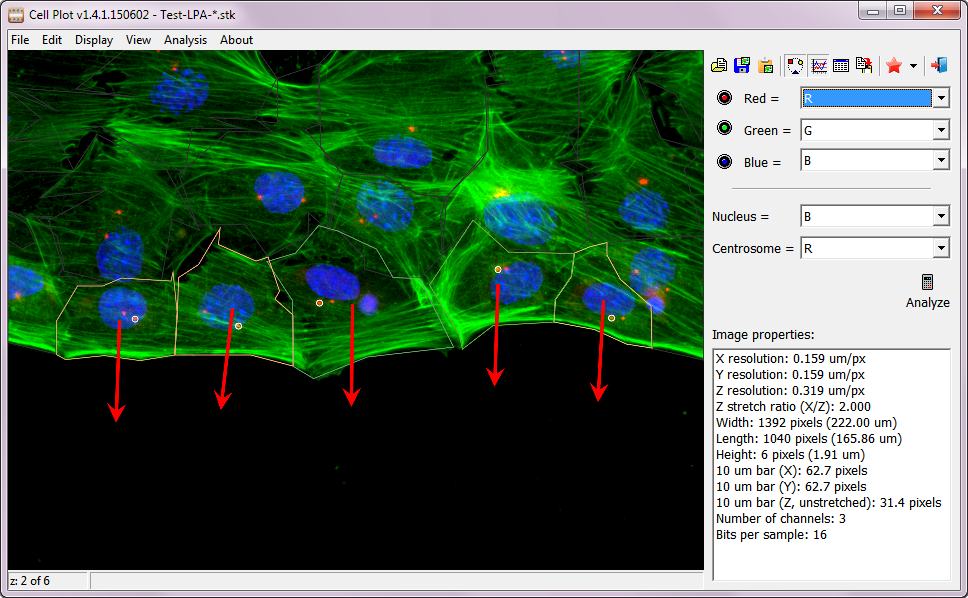
Cell Plot contains only one single.exe file, and doesn’t require installation. It also doesn’t rely on any external software bundles, likeMATLAB orJava virtual machine.Cell Plot has a built-in color mixer, allowing users to change channels to display.- User can select cells to be included in the final results – simply double click a cell to include/exclude it.
- Cell boundary can be modified by moving the boundary points. Clicking on the lines adds end points. Double clicking on a point removes it.
- Holding the
Alt key and draw a shape around a nucleus, the cell boundary will be replaced with the shape. - Direction of cell migration (the arrow) can be changed by moving the arrow. The arrow is used as the Y-axis of the cell in all measurements.
- Centrosome position (white dot) can be moved.
- All images in an experiment can be saved as stacks and can be analyzed at the same time. Use
PgUp andPgDn to navigate between images. - Final results can be copied to the clipboard. Simply paste them in to
Excel for further statistical analysis. - All results, including manually changed cell boundaries, are automatically saved (in a file named
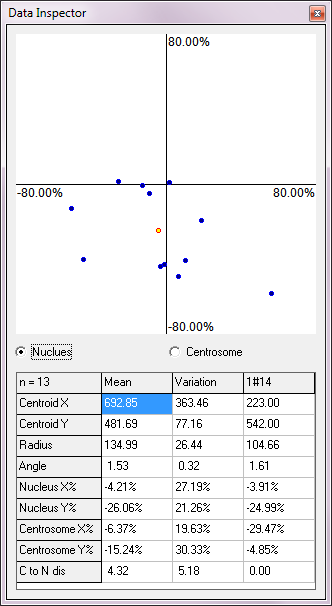
CellPlot.dat ), so that a user can always go back and review/modify their analysis. Note: a singleCellPlot.dat is created in a folder, and is used for all images in that folder. - A data inspector provides real time summary of the results. Top of the inspector is a plot, in which each point represents result from a cell. Clicking on a point moves to the image with the cell and highlights the cell.
Notes
Cell Plot can open regular.tif files and.stk files (a TIFF variant used byMetamorph ). TIFF files with a single image or a stack of images are supported. When using images with single channel, the file name should ended with-G ,-R ,-B ,-I ,-Green ,-Red ,-Blue , or-FarRed (case-insensitive). When opening a file whose name ended with them,Cell Plot will look for the other files and open them as a multi-channel image.Cell Plot can open old.lsm files from Zeiss microscopes.Cell Plot can open new.czi files from Zeiss microscopes.- Nikon considers the ND2 file format private and will not publish its specification.
Cell Plot can open.nd2 files from Nikon microscopes, but it requires the installation of a DLL library from Nikon’s SDK. Please request the SDK from Nikon and extract its DLL files in to a subfolder namedNd2Reader next toCellPlot.exe . It may not work though, as my experiences with the DLL library varied, especially onWindows 10 .
How to use
Please download
- Double click to run
CellPlot.exe . - Drag and drop one of the
.stk files to onCell Plot . - Click the “Cell” button and
Cell Plot will start to analyse the images. - Use the mouse to play around with the boudaries, the centrosome dots and the arrows.
- Have fun!
Here is a short close-captioned video tutorial.